
Week 14 - Oura Ring Dashboard

This week I created a web dashboard to compare two people’s Oura Ring data side by side.

Tools I used
Oura Ring Python API package - easy interface to the Oura API
Flask - a Python web application framework
Chartjs - for displaying the data in an interactive chart
PythonAnywhere - a web hosting platform optimized for Python apps
ChatGPT - to teach me Flask
Context
I have had an Oura Ring for a bit over a year, and it’s been a fun and informative way to get insights into some of my body’s rhythms. Each day it gives you a bunch of metrics corresponding to things like your heart rate, your breathing, sleep cycles, exercise and then boils that down to three scores: Readiness, Sleep, and Activity.
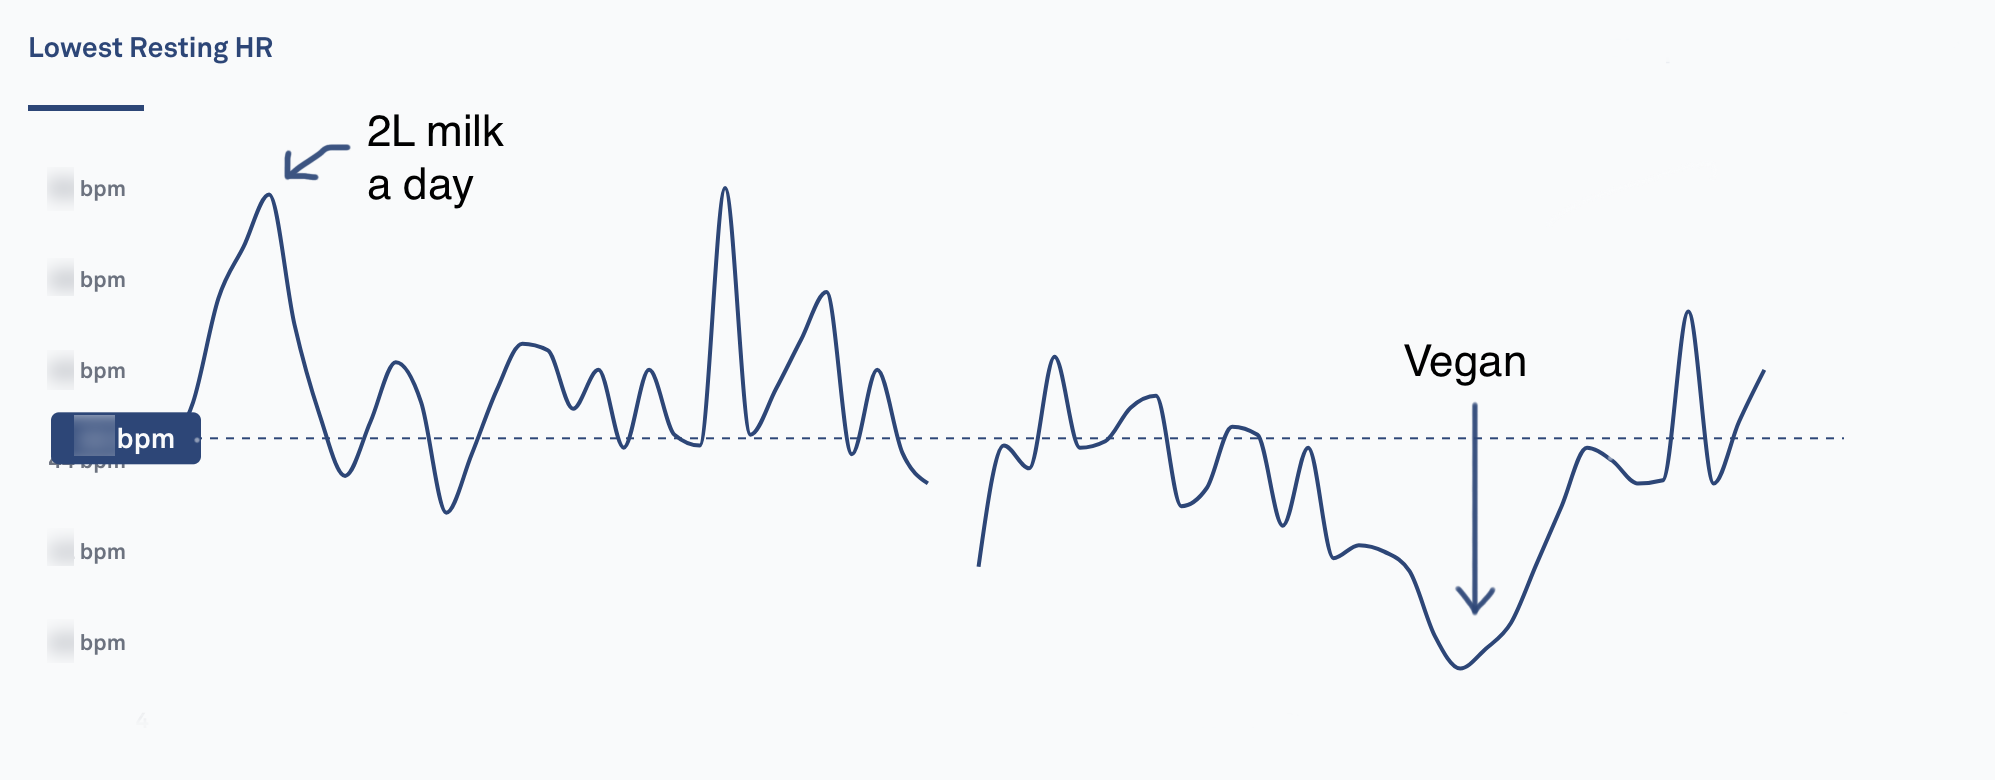
I find it fascinating to see how my body responds to different environmental and dietary experiments. Below are some interesting charts of mine (I’ve mostly blurred out the values for privacy, but you can see the trends).
My lowest resting heart rate on 2 extremes: drinking 2 litres of milk a day for a month, vs being vegan for a month
Average daily rest time soared during my 10 day Vipassana (restful isn’t actually how I would describe the experience at all, but the ring can’t access my mind yet)

Covid, not surprisingly, sends certain things skyrocketing. Here’s my temperature and respiratory rate


I’ve just moved to Mexico City, which is 2,240 m in elevation and has only 77% of the air pressure of sea level. As a result, my oxygen saturation has dropped

My partner, P, also has an Oura Ring. We often compare our scores (particularly Sleep and Readiness), and since our bodies operate rather differently, we get pretty different numbers. While the Oura app and the web app have very intuitive and beautiful interfaces, but there’s no easy way to compare two people’s data. This week I wanted to try to use the Oura API to make a dashboard that could compare 2 Oura ring data on the same chart.
Process
The process this week isn’t terribly exciting, it mostly involved a lot of debugging and head banging against the wall as I wrestled with Flask for the first time with my rusty Python.
I first found an Oura Ring Python API client that someone had made, so I decided to try using Python for this project. Flask is the most well-known Python web app framework, so I worked with ChatGPT to build out a local web app.
The app would have two pages - a login screen where you enter your name and Oura personal access tokens (generated from the Oura website), and the main dashboard page with a date picker and charts.


Here it is running locally with 2 Oura tokens looking at Sleep and Readiness scores side by side for both people:

The final step was to get this on the web so anyone could enter their own Oura tokens and compare their data. I pushed my code to a Github repo, created an account on PythonAnywhere, and copied the files across. I expected the app to run straight away, but there were many extra steps I didn’t anticipate: setting up a production server (gunicorn) instead of the Flask dev server, adding in secret keys, a .env file, setting up the virtualenv on the server, combing through the PythonAnywhere logs…
Also, I discovered the PythonAnywhere has a whitelist for accessing external sites from your app. I submitted a request to have the Oura API added, but I’m not sure how long it will take for them to respond to that request.
Here’s the live site: https://ouradashboard.pythonanywhere.com/ - at the moment it fails on submit because it can’t ping the Oura API. I’ll update here if the whitelist gets added, but for now my blood oxygen is low and I’m keen to finish this week’s project! So that’s as far as I got. (EDIT - April 17, 2023 - they have whitelisted the Oura API so the site now works, give it a try)
Learnings
Developing Flask, particularly getting it running in production, was pretty frustrating. There was a lot of fiddling around in bash consoles, setting config files and secret keys, etc that I’m not familiar with and don’t enjoy. That’s the part of web development that I hope is soon completely abstracted away
In general, while I do enjoy the challenge of coding, I actually prefer the outcome to the coding. Getting stuck in the weeds of frameworks and backend configuration just isn’t that exciting to me
Adjusting to high altitude makes me a bit slow..
I felt energized looking at some of the trends from the Oura ring data as it relates to events and experiments in my life. More experiments!
Next steps
Get the web version actually working
Currently the dashboard only shows Sleep and Readiness scores. I’d love to let the user choose which other metrics they’d like to look at
Improve the look of the dashboard and charts
Add a correlation metric to see how two people’s scores are related